Every Report Is Only as Good as Its Visualisation and Presentation
To communicate FP&A findings effectively, organizations must prioritize data visualization and presentation. By leveraging Apliqo's platform, organizations can create engaging reports, drive informed decision-making, and enhance their strategic value.
Nov 29, 2021
//
4
min read
Subscribe to Apliqo Insights
“FP&A helps analyse the past, understand the present, and plan for the future.” - Geetanjali Tandon, Finance Director for Bayer Crop Science.
FP&A is about much more than crunching numbers, it is about driving better business decisions and helping steer the company ship in the right direction.
Unfortunately, the immense power of FP&A is lost if your audience can’t decipher the financial plans and analysis your team has to offer. In this article, we’ll teach you the importance of using data visualisation and presentation to ensure that your analysis has the intended impact on your organisation's strategy.
What Is Data Visualisation and Presentation?
Data visualisation is about taking the core findings of your analysis and giving them meaning. As CFOs and FP&A professionals, we need to remember that the people reading our reports and analysis often don’t come from a finance background. However, with the help of data visualisation we can help key decision makers use our reports and analysis to make the best strategic decisions.
We recently explored the importance for CFOs and FP&A teams to take on the role of business partners. That is, to ditch our traditional accounting or analyst roles for a seat at the head of the company table where we can change conversations, identify opportunities, and impact important decision making.
Visualisation plays a key role in streamlining this vital transition. As FP&A professionals, it is our responsibility to inform key stakeholders/leaders about our organisation's performance and identify ways to improve it. Using visual tools to highlight the relevant findings of our analysis is one of the most effective ways to drive them home to our audience.
Presentation is an equally important aspect of communicating the findings of our financial reporting, analysis, and planning. Analysing data and visualising our findings isn’t enough; in order for our analysis to have a real impact on our audience, it needs to be communicated and presented in a way that connects with our audience, be it a company’s CEO or another department within our organisation.
In order to engage your audience when presenting the findings of your analysis, you need to be able to ditch the finance jargon and develop narratives that help guide and support stakeholders in their decision-making.
The Challenges of Visualising and Presenting FP&A
Communicating and visualising the core findings of financial analysis is something even experienced CFOs and finance professionals struggle with. As mentioned by our CEO Daniele Tedesco in his recent article on The Importance of Communication and Presenting For CFOs, this often comes down to:
The accounting mindset,
A lack of finance literacy, and
A lack of time and resources to stop, analyse, and improve our FP&A processes.
Furthermore, meeting the sudden need for more visual, intuitive, and engaging analysis is a huge challenge in itself. Unfortunately few FP&A professionals receive formal training in how to visualise, present, and communicate their findings and are often left to learn these skills on the job. As a result, many companies rarely see their FP&A visualisation and presentations go beyond Excel and PowerPoint.
Finally, and arguably one of the biggest hindrances to FP&A visualisation and presentation is the lack of a service mentality. In order for finance to take on the role of a strategic business partner, finance professionals need to ditch their accounting hats and learn to see themselves as strategists providing a key service to their organisation.
Tips to Improve the Visualisation and Presentation of Your Analysis
Identify the right KPIs and business drivers to measure your company’s performance. Rather than flood your audience with big sets of numbers and statistics, hit them with the values that matter most. Learning to trim the fat is key to creating richer, more engaging analysis.
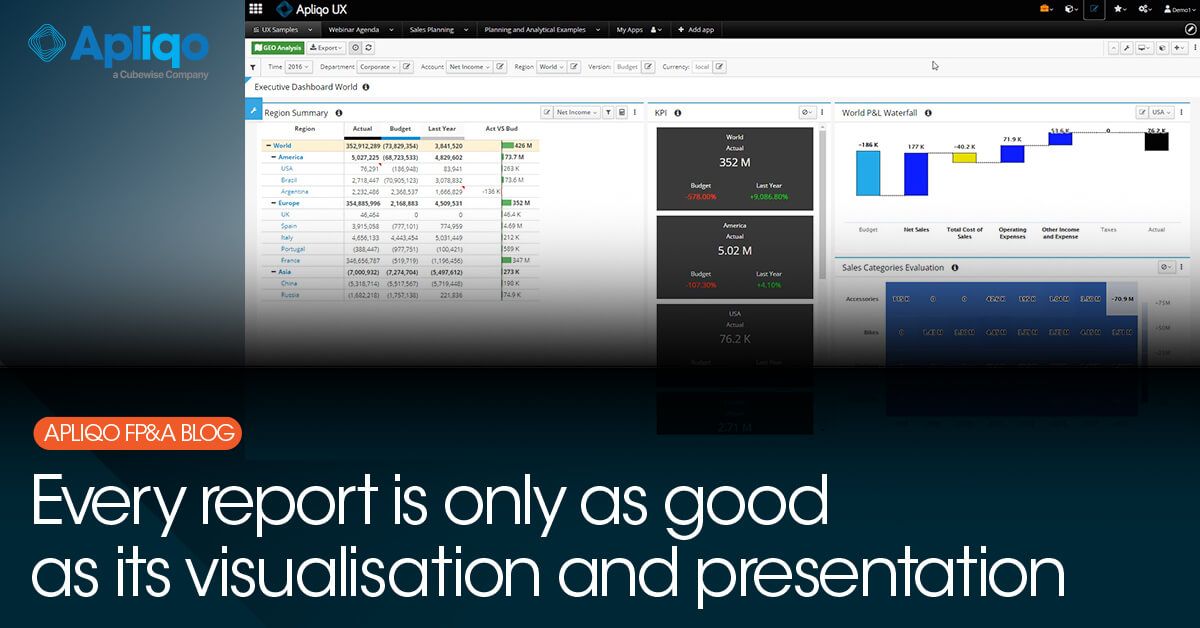
Leverage a central FP&A platform to handle all of your company’s reporting, analytics, and visualisation and to gain deeper insights into your business and effectively drive its performance.
Adopt a service mentality. Stop seeing FP&A as a finance formality and realise its potential as a core driver of organisational strategy.
Know your audience. Once you understand FP&A as a service, it’s time to develop a key understanding of each of your internal clients across the organisation and adapt your visuals/presentations to their individual needs.
Become a business partner. Connecting and collaborating with your clients is the only way to understand their needs, change conversations, and drive value across the organisation.
Learn from the legends. Stephen Few, Cole Nussbaumer and the late Hans Rosling are highly revered as experts in data visualisation. Familiarising yourself and your team with their work is key to changing the way you present the findings of your analysis.
Finally, one of the best ways to improve the way you present your financial plans and analysis is by registering for our FP&A Masterclass with Jack Alexander. Covering everything from the FP&A imperatives of COVID-19 to effectively presenting and communicating financial analysis, our Masterclass combines a vast amount of Jack's expertise. While the first instalment of the Masterclass has come to a close, you can sign up for free on-demand access to all of Jack’s masterclasses here.